
Reading the results
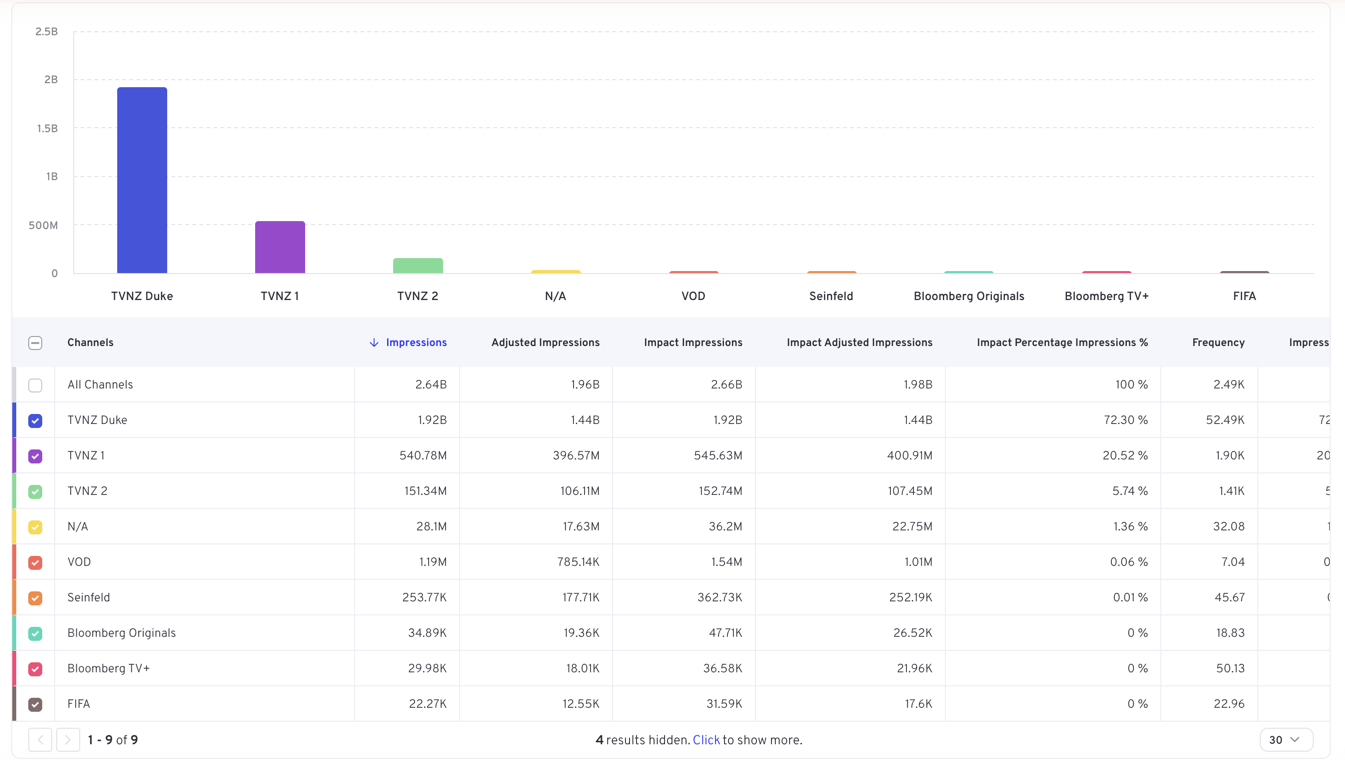
After Submit, results appear as a chart with a table underneath. Both show the same query; the row of controls above them changes how it is presented.
Metric
The first dropdown chooses the metric the chart plots and the table sorts by — impressions, reach, revenue metrics and whatever else your dataset provides.
Switching metric redraws the chart from data you already have, so it is instant. The table always shows every available metric as a column regardless of this setting; the metric selector decides which one the chart is drawn from.
Interval
The second dropdown splits the results over time.
Total — the default — gives one figure per breakdown value for the whole period. Any other interval splits that period into buckets: Hour, Day, Week and so on.
Options that do not suit your date range are greyed out. Over a seven-day range, for example, minute-level intervals are unavailable because they would return an unusable number of points, and Month is unavailable because the range is shorter than a month.
TIP
If the interval you want is greyed out, widen or narrow the date range — interval availability is derived from it.
Chart type
The third control switches between chart types:
| Type | Best for |
|---|---|
| Column | Comparing breakdown values against each other |
| Line | Showing a trend over time |
| Pie | Showing composition — each value's share of the total |
Line is unavailable while the interval is Total. A line needs a time axis, so set an interval such as Day or Week and it becomes selectable.
The table
The table lists one row per breakdown value, plus a total row (for example All Ad Types) that aggregates them.
- Sorting — select any column header to sort by it; select again to reverse. An arrow marks the sorted column.
- Row selection — the checkbox on each row controls whether that value appears in the chart, and the colour beside it matches its chart series. Untick the noisy values to see the rest.
- Paging — long result sets are paged, with the page size selectable at the bottom right.
WARNING
Percentage columns are calculated across the rows the query returned, not across your whole dataset. Add a filter and the percentages change accordingly.
Display options
Options opens a dialog of presentation settings, split between chart and table.
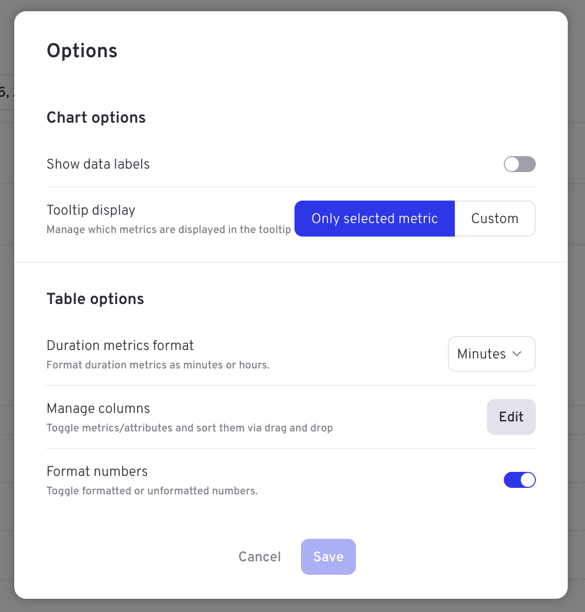
Chart options
| Setting | What it does |
|---|---|
| Show data labels | Prints the value on each column, point or slice |
| Tooltip display | Only selected metric shows just the charted metric on hover; Custom lets you choose which metrics the tooltip includes |
Setting the tooltip to Custom is a quick way to read several metrics at once without adding columns or re-running anything.
Table options
| Setting | What it does |
|---|---|
| Duration metrics format | Shows duration metrics in minutes or hours |
| Manage columns | Edit opens a list where you can toggle metrics and attributes on or off and drag them into the order you want |
| Format numbers | Toggles thousands separators and abbreviations (1.2M) — turn it off when you want full precision to copy elsewhere |
Choose Save to apply, or Cancel to discard.