
Reports
Reports are prepared dashboards. Where Research answers a question you've just thought of, a report answers the same question every day without anyone rebuilding it.
They're built for your team, so the ones in your menu are yours — the names, the widgets and the metrics were chosen for how you work. Find them under the reports menu in the navigation bar — labelled Reports or Inventory depending on your setup.
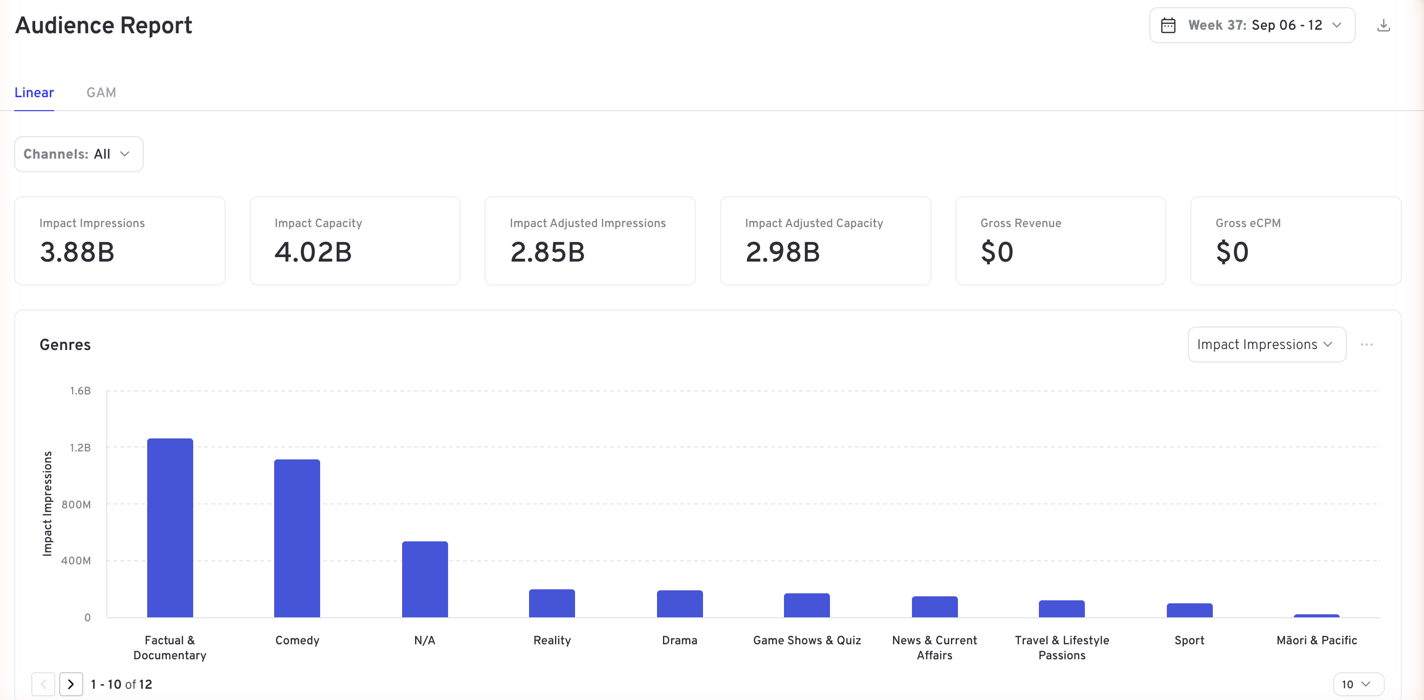
Finding a report
Depending on your setup, reports are listed either in the Reports menu itself, one entry per report, or down the left of the report page with a search box above them. If a list is long, search rather than scroll; a left-hand list can be collapsed with the arrow at its top edge to give the report more room.
The report header
Every report carries two controls that apply to the whole page:
- Date range — the period the report covers
- Download — takes the report away as a file
Changing the date range re-runs everything on the page.
Tabs
Larger reports are split into tabs, each a different cut of the same subject — for example an overview, then breakdowns by platform and by content. Tabs share the report's date range and filters, so you can move between them without setting up again.
Filters
Below the tabs sit the report's filters, shown as chips with their current value (commonly All). Narrow one and everything on the page follows.
Filters are chosen when the report is built, so each report exposes the handful that matter for its subject rather than every dimension in the dataset.
Widgets
The body of a report is made of widgets — tiles for headline numbers, then tables and charts.
Each table and chart has a … menu in its top right:
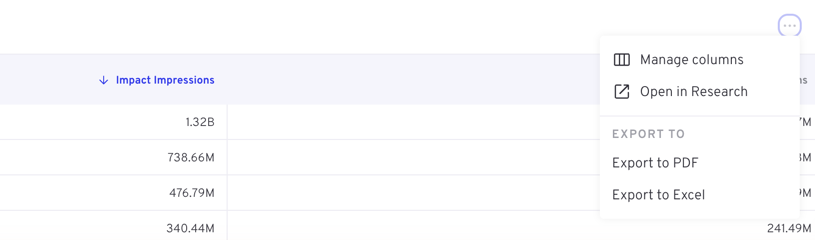
| Action | What it does |
|---|---|
| Manage columns | Tables only: choose which columns the table shows, and their order |
| Data labels | Charts only: print the values on the chart |
| Open in Research | Opens this widget's query in Research |
| Export to | Downloads the widget as a PDF, or its data as an Excel spreadsheet |
Open in Research is the useful one
A report shows you that a number moved. Open in Research carries that widget's query straight into Research, where you can add filters and change the breakdown to find out why — without rebuilding the query by hand.
Try it: from a report to an answer in three steps
- Open any report and find a table or chart.
- From its … menu choose Open in Research.
- In Research, add a filter or change the breakdown, then press Submit.
You have turned a monitoring view into an investigation without rebuilding the query.
Reports vs Research
| Reports | Research | |
|---|---|---|
| Built by | tvbeat, for your team | You, as you go |
| Question | Known in advance, asked repeatedly | New |
| Layout | Fixed | Whatever you set up |
| Best for | Monitoring | Investigating |