
Exporter
Exporter produces data files. It's the tool for extracts too large for the screen — many metrics at once, long periods, fine intervals — and it runs them in the background so you don't sit waiting.
Find it under Tools → Exporter.
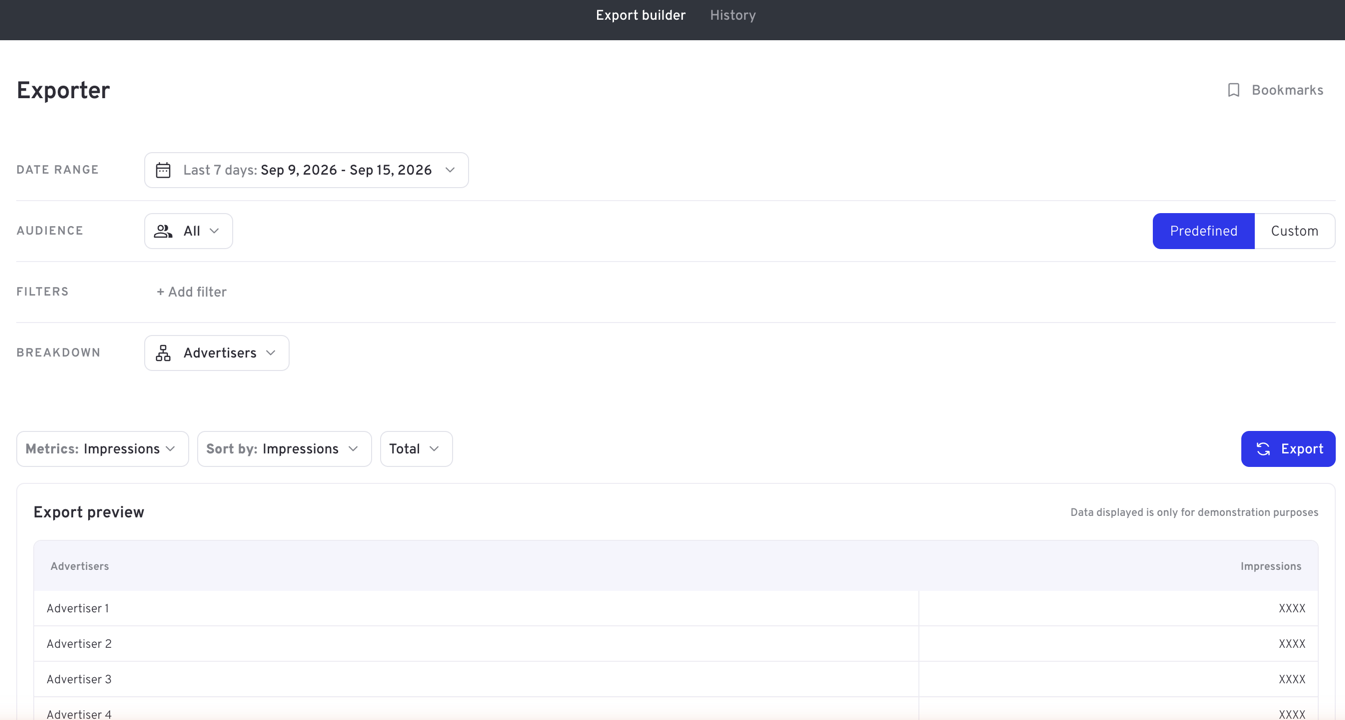
Building an export
The query controls are the same as Research: date range, audience, filters and breakdown. If you can build it in Research, you can build it here.
The row underneath is where they differ:
| Control | What it does |
|---|---|
| Metrics | Which metrics become columns — a multi-select, with search and All |
| Sort by | The metric the file is ordered by |
| Interval | Total, or split over time |
| Export | Queues the export |
The important difference from Research is Metrics: Research charts one metric at a time, whereas an export can carry as many columns as you need in one file.
The preview
Export preview shows the shape of the file — its columns and how rows will be laid out — using placeholder values rather than real ones. It's there to confirm the structure before you commit, so check the columns are the ones you want, then export.
History
The History tab lists what you've queued, filtered by state: All, In progress, Completed, Failed and Cancelled. Completed exports are collected here to download, and it's also where a failed export tells you it failed.
Because exports run in the background, you can start one and carry on working — or close the dashboard and collect it later.
Which tool?
Reading on screen, or checking a number → Research. Feeding a spreadsheet or another system → Exporter.
Exports you've generated are also reachable from Exports in the account menu.