Research
Research is the querying tool at the heart of the dashboard. You choose a period, an audience, some filters and one dimension to break the data down by, and Research returns the answer as a chart and a table.
Unlike Reports, which are built for you in advance, Research queries run in real time against your dataset. Nothing is pre-calculated, so you can ask a question that nobody anticipated and get an answer immediately.
Find it under Tools → Research.
When to use Research
| Use Research when… | Use something else when… |
|---|---|
| You have an ad-hoc question about your data | You need the same view every morning — use a Report |
| You want to slice one dimension by a metric | You want to compare audiences against a baseline — use Ranker |
| You want to check a number before sharing it | You need the raw rows in a spreadsheet — use Exporter |
Anatomy of the page
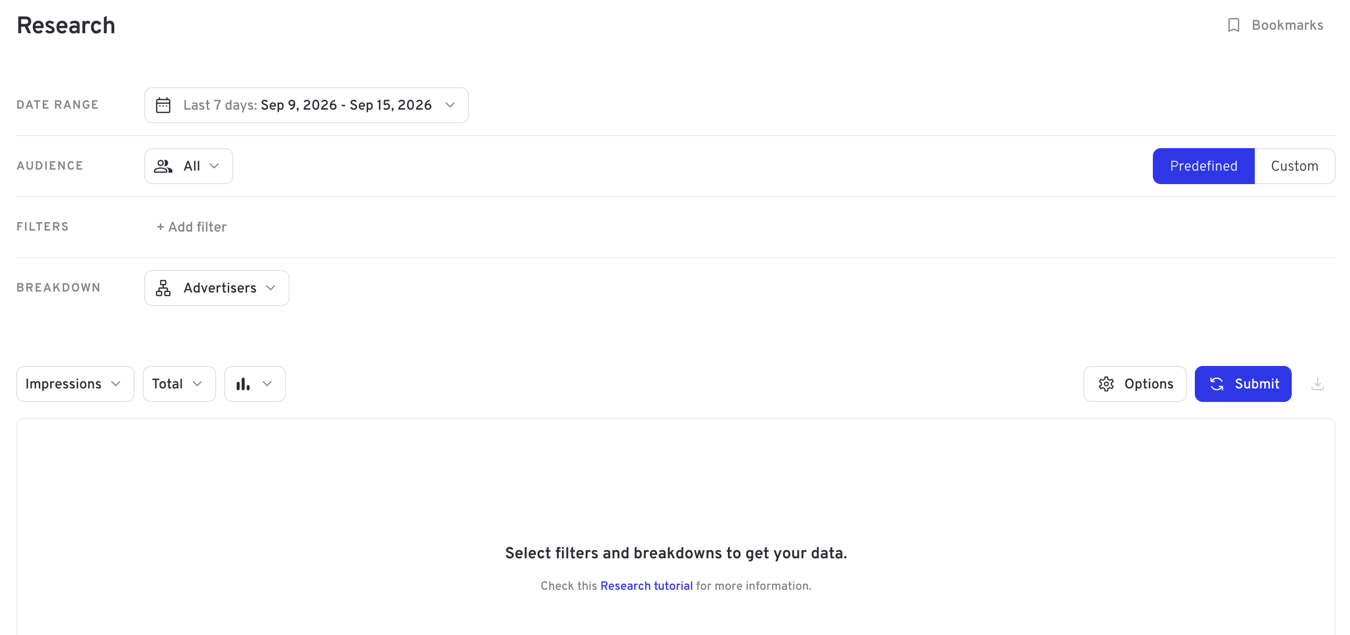
The page is split into two halves. The top half is the query — everything that defines the question you are asking:
| Control | What it does |
|---|---|
| Date range | The period the query covers |
| Audience | Whose viewing to count — everyone, or a defined group |
| Filters | Narrows the data before it is counted |
| Breakdown | The dimension the results are split by |
The bottom half is the display — how the answer is shown. The metric selector, the interval, the chart type and the Options dialog all change the presentation of the same result.
TIP
Changing anything in the top half needs a new Submit, because the data has to be recalculated. Most changes in the bottom half redraw instantly using data you already have.
Your first query
- Pick a date range — it defaults to the last 7 days.
- Leave Audience on All for now.
- Choose a Breakdown — this is the one setting a query cannot run without.
- Press Submit.
- Use the metric selector under the query to switch between Impressions, Reach, revenue metrics and anything else your dataset provides.
Until you choose a breakdown and submit, the results area shows "Select filters and breakdowns to get your data."
What comes next
- Building a query — date ranges, audiences, filters and breakdowns in detail
- Reading the results — metrics, intervals, charts, the table and display options
- Saving and sharing — bookmarks, links and exports