
Ranker
Ranker answers a different question from the rest of the dashboard. Instead of how much did this audience watch, it asks where are they unusually concentrated — which channels, dayparts or platforms over-deliver for them relative to everyone else.
Find it under Audience → Ranker.
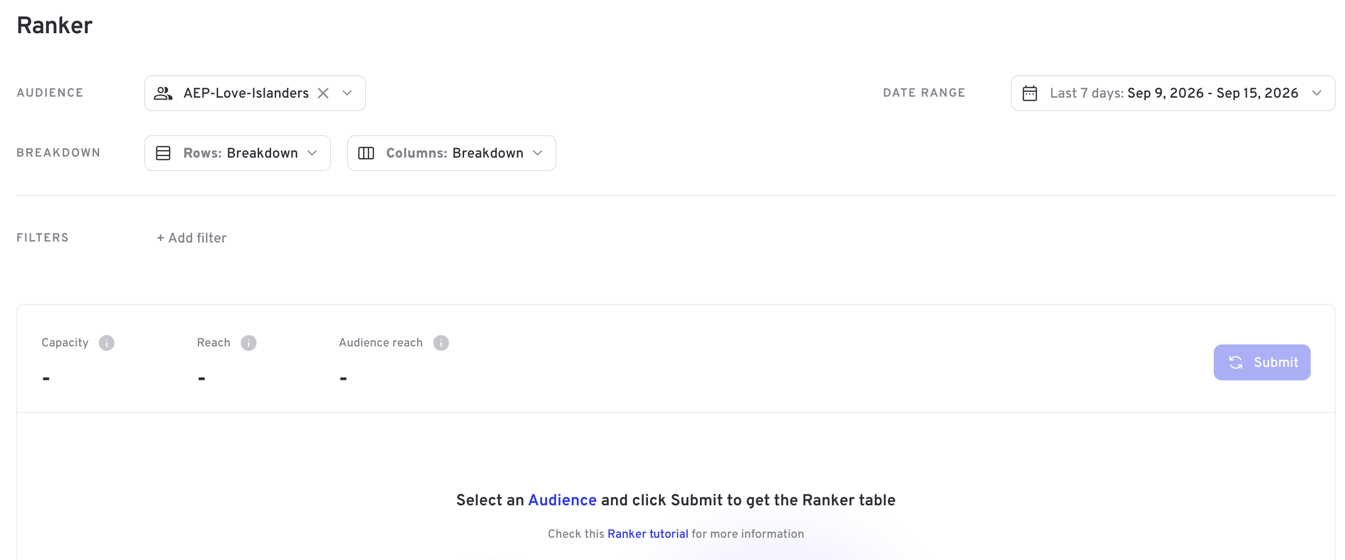
Setting it up
| Control | What it does |
|---|---|
| Audience | The audience to examine. Required — Ranker has nothing to compare without it |
| Date range | The period |
| Rows | The dimension down the side of the table |
| Columns | The dimension across the top |
| Filters | Narrows what's considered, as elsewhere |
Choosing both a row and a column dimension is what makes Ranker a cross-tab: every cell is one combination, so you can see, for example, ad type against channel in a single pass.
Audiences come from Audience manager, and you can create one without leaving the page.
Reading the results
Above the table, three figures give context:
- Capacity — the opportunities available
- Reach — unique people reached overall
- Audience reach — how many of them were in your audience
The table itself is an index, shaded as a heat map. An index compares your audience's presence in a cell against the baseline:
| Index | Reading |
|---|---|
| 100 | Exactly as expected — no skew |
| Above 100 | Over-indexes — the audience is concentrated here |
| Below 100 | Under-indexes — thinner than average |
An index of 200 means the audience is about twice as likely to be found there as the baseline population. Darker shading marks the stronger cells, so the pattern is readable before you read a single number. A dash means there was nothing to compare.
WARNING
A high index is a statement about concentration, not volume. A tiny cell can index extremely well while reaching almost nobody. Read the index alongside reach before acting on it.
Related
- Audience manager — define the audiences Ranker examines
- Research — once you know where an audience concentrates, measure how much it watched there