
Building a query
A Research query is made of four things: a date range, an audience, any filters, and a breakdown. Only the breakdown is mandatory.
Date range
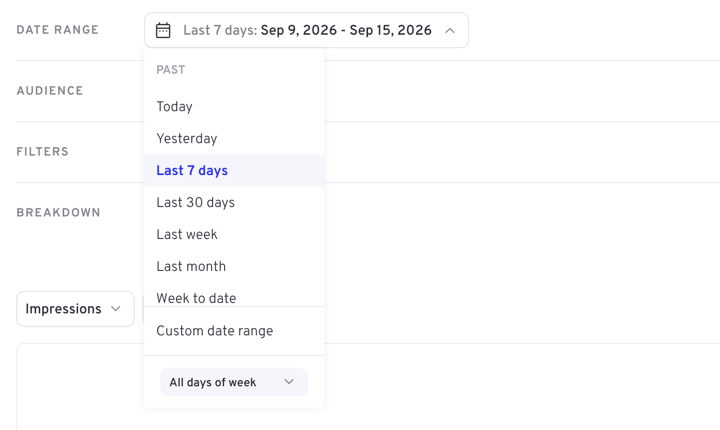
Open the date picker to choose the period. Alongside a calendar for picking exact days you get a set of presets:
| Preset | Covers |
|---|---|
| Yesterday | The single previous day |
| Last 7 days / Last 30 days | A rolling window ending yesterday |
| Last week / Last month | The previous complete week or month |
| Week to date / Month to date | The current week or month so far |
| Custom date range | Any start and end date you choose |
Days of week
Underneath the presets is a days of week selector, set to All days of week by default. Narrow it to compare like with like — weekday daytime against weekend daytime, for example — without having to run separate queries.
TIP
The date range also decides which intervals you can break time down by. A short range unlocks fine intervals like Hour; a long one unlocks Week and Month. See Reading the results.
Audience
Audience decides whose viewing is counted, as opposed to filters, which decide what is counted.
- Predefined — pick from the audiences already defined for your dataset. All means no audience restriction.
- Custom — build an audience for this query from the attributes available in your dataset.
Audiences you expect to reuse are worth creating properly in Audience → Audience manager instead, so they appear in the Predefined list for everyone.
Filters
Filters narrow the data before it is counted. Select + Add filter to open the picker.
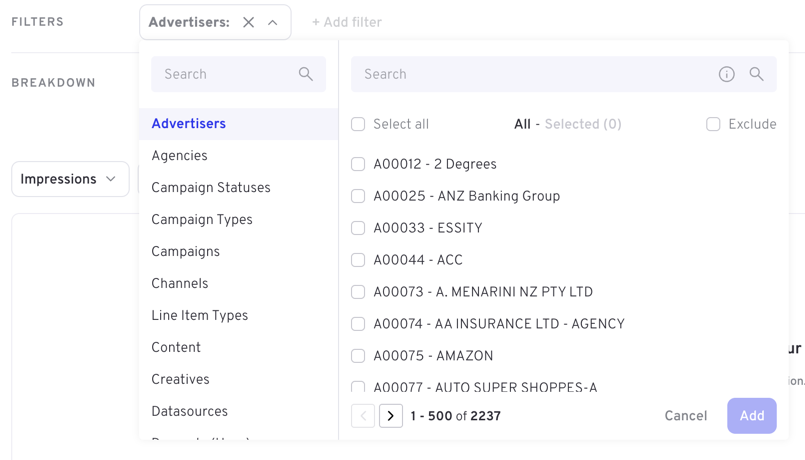
The picker has two panes:
- Left — the dimensions available in your dataset. Use the search box at the top if the list is long.
- Right — the values of the dimension you selected. Tick the values you want, then choose Add.
Useful controls in the right pane:
| Control | Effect |
|---|---|
| Search | Find a value without scrolling |
| Select all | Tick every value currently listed |
| Exclude | Invert the selection — keep everything except what you ticked |
Exclude is the quickest way to express "everything but". Rather than ticking forty-nine values, tick the one you want rid of and turn Exclude on.
Each filter you add appears as a chip next to Filters. Select the chip to edit it, or the ✕ to remove it. Filters on different dimensions narrow each other — a query filtered to one channel group and one ad type returns only rows matching both.
WARNING
The dimensions and values on offer come from your dataset, so they differ between platforms. What each dimension means for your data is covered in your own client documentation, not here.
Breakdown
The breakdown is the dimension your results are split by — it becomes the first column of the table and the categories along the chart.
A query has exactly one breakdown, and it is the one control a query cannot run without. If nothing is selected, Research prompts you to choose one instead of returning results.
Filters and breakdown work together: filter to narrow the population, break down to divide what remains. "Impressions by ad type, for one channel" is a channel filter with an ad-type breakdown.
Once all four are set, press Submit.